

Question: Suppose Bellevue University accepts new students into its program year round on a tri semester schedule (Fall, Spring, and Summer). Forecasting future enrollments helps the
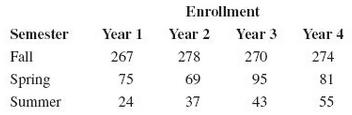
Suppose Bellevue University accepts new students into its program year round on a tri semester schedule (Fall, Spring, and Summer). Forecasting future enrollments helps the school ensure it has the proper resources to accommodate the student body. The following data show the number of students who enrolled each semester for the last four academic years. (Year 4 is the most recent year). These data can also be found in the Excel file Bellevue. xlsx.
a. Construct a graph showing the student enrollment over time.
b. Forecast the student enrollment for each semester in Year 5 using seasonal dummy variables and a best subsets regression.
c. Interpret the meaning of the coefficients for the seasonal dummy variables.
d. Calculate the MAD for this forecast.
Enrollment Semester Year Yea 2 Year3 Year 4 Fall Spring Summer 267 75 24 278 69 37 270274 95 43 81
Step by Step Solution
3.27 Rating (179 Votes )
There are 3 Steps involved in it
a Set x1 Period x2 SD1 x3 SD2 b F t 262717 1733t 193983SD 1 235967SD 2 F Y5Fall 262717173313... View full answer

Get step-by-step solutions from verified subject matter experts
Document Format (1 attachment)
483-M-S-F (256).docx
120 KBs Word File