

Suppose that, for each of three age groups (25-34, 35-44, and 45-54), we have recorded yearly sex-specific
Question:
Suppose that, for each of three age groups (25-34, 35-44, and 45-54), we have recorded yearly sex-specific lung cancer mortality rates for the five-year period 19! through 1994. These data are to be analyzed by Poisson regression methods to seel whether the change (if any) in log rate over time varies by age-sex group and, if so, quantify that variation. In what follows, we will index the six age-sex groups, as
group l(i = 1):……………………………… 25-34-year-old females
group 2(i = 2):……………………………... 35-44-year-old females
group 3(i = 3):……………………………… 45-54-year-old females
group 4(i = 4):……………………………… 25-34-year-old males
group 5(i = 5):……………………………… 35-44-year-old males
group 6(i = 6):……………………………… 45-54-year-old males
Consider the following model for the expected cell count E(Yik) for age-sex group year (1990 + k), where i= 1,2,3, 4, 5, 6 and k = 0, 1, 2, 3, 4:
E(Yik) = likλik
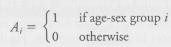
where
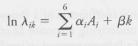
Here lik and λik, are, respectively, the person-years at risk and the (unknown) population lung cancer mortality rate in cell (i, k). The independent variables in model (1) are defined as follows:
k = (year – 1990)
a. What is the total number n of data points, or pairs {lik, Yik), for this data set!
b. Based on model (1), what is the expected cell count for a 40-year-old male in written as a function of a5 and β?
c. For the ith age-sex group, how does model (1) describe the change in log rate overtime3?
d. What does model (1) assume about the effect of age-sex group on the change in log rate over time?
e. Find a general expression for
RRik = λik/λ10
the rate ratio comparing the mortality rate for age group i and year (1990 + k)10 the mortality rate for the reference category "25-34-year-old females in 1990
f. Suppose that it is of interest to assess whether the change in log rate over time actually varies by age-sex group (i.e., whether there is a group-by-time interaction). By adding appropriate cross-product terms to model (1), construct a model that will permit such an assessment and then discuss how one would interpret this model.
Consider the following Poisson regression ANOVA table, based on fitting various models to the data under study:
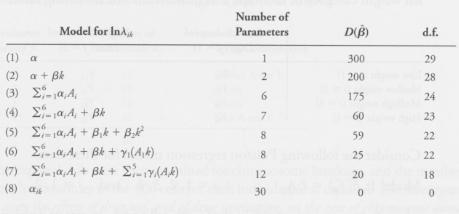
Using this table, answer the following questions:
g. Ignoring (for now) the variable "time," is there evidence that average mortality rates differ among the six age—sex groups?
h. Is adding the linear time term ([3k) to model (3) worthwhile?
i. Assuming that the change in log rate over time is the same for all age-sex groups, do the data argue for adding a quadratic time term to a model that already contains a linear component of time?
j. Is there evidence in the data that the change in log rate over time differs for different age-sex groups?
k. Carry out a test of HQ: "All six age-sex groups have the same slope" versus HA: "All age-sex groups except group 1 have the same slope." 1. Of the models that fit the data well (use a = .1 for any test of lack of fit that you perform), which one would you choose as your final model? Why? m. For your final model chosen in part (1), calculate a pseudo-R2-value. n. Now, assume that model (6) has been fit to the data, resulting in the following regression coefficient estimates and standard errors:
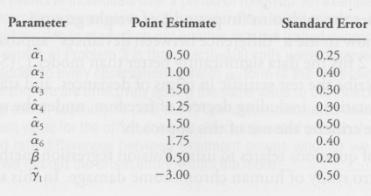
o. Find and interpret approximate 95% confidence intervals for the following time-related parameters: (1) the common slope for age-sex groups 2 through 6 and (2) the slope for age-sex group 1. [The estimated covariance between β and γ1 is

Step by Step Answer:
a n 30 6 agesex groups x 5 years b Here i 5 and k 1992 1990 2 so that EY 52 52 52 52 e a52 c Log rat...View the full answer


Applied Regression Analysis and Other Multivariable Methods
ISBN: 978-1285051086
5th edition
Authors: David G. Kleinbaum, Lawrence L. Kupper, Azhar Nizam, Eli S. Rosenberg
