

Data Analysis And Probability A Quickstudy Laminated Reference Guide(1st Edition)
Authors:
Peggy Warren ,Susan Wright ,Llc Expolog
In Stock: 2 Left
Shipment time
Expected shipping within 2 - 3 DaysPopular items with books
Total Price:
$0
Solution Manual Includes
Price:
$9.99
Book details
ISBN: 1423247272, 978-1423247272
Book publisher: Quickstudy
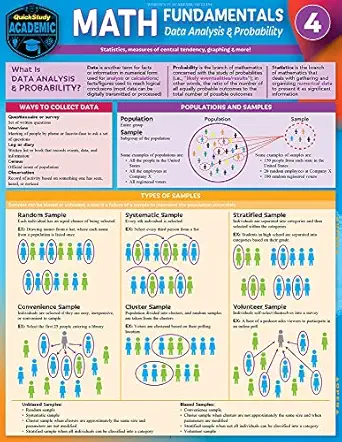
Book Price $0 : Essential Core Elements Of Mathematics To Support Early Learning, Continued Development, And As A Reference To Review During And After Building A Strong Foundation. Seeing A Broad Overview And How The Details Make The Math Possible In Just 6 Pages Can Melt Away Some Math Phobia And Will Strengthen Skills And Grades. Written And Tested In A Classroom Over Many Years, Two Teachers Came To Us With This Reference They Used With Their Students. A Math Textbook Authoring Group Then Expanded The Series. With Experts In The Classroom And In Textbooks Developing The Content, Donâ??t Pass Up This 6 Page Laminated, Inexpensive Tool With The Power To Support The Core Areas Of Math Students Struggle With. Check Other Titles In The 5-guide Series For The Areas Of Support Most Needed.  6 Page Laminated Guide Includes:Ways To Collect DataPopulations & SamplesTypes Of SamplesRandom SampleConvenience SampleSystematic SampleCluster SampleStratified SampleVolunteer SampleMeasures Of Central TendencyMeasures Of SpreadRangeInterquartile Range (IQR)When To Use Measures Of Center & SpreadSymmetric Distribution (also Called Normal Distribution)Negatively Skewed Distribution (also Called Left Skewed Distribution)Positively Skewed Distribution (also Called Right Skewed Distribution)Interpretation Of GraphsWays To Prevent Misinterpretation Of GraphsGraphing DataChecklist For Making GraphsData DisplaysPictograph, Frequency Table, Tally MarksBar Graph, Double & Multiple Bar Graphs Stacked Bar Graph Two-Way Frequency & Relative Frequency TableCircle Graph (also Called Pie Chart) & Steps To Make Circle GraphScatter Plot & Steps To Make A Scatter PlotBox-and-Whisker Plot & Steps To Make A Box-and-Whisker PlotHistogram & Steps To Make A HistogramDistributions In HistogramsLine Graph & Line PlotStem-and-Leaf PlotMultiple Line Graph Double Stem-and-Leaf PlotInterpreting StatisticsInterpolation / ExtrapolationNormal DistributionVenn DiagramTo Determine If A Set Of Data Has Any Outliers: MatrixDisjoint SetsInterpreting The Venn DiagramProbability
Popular Among Students (8)
Wave Propagation Approach For Structural Vibration - 1st Edition
Chongjian Wu
ISBN: 9811572364, 978-9811572364
$60.31 $86.16
Statistical Methods For Communication Researchers And Professionals - 1st Edition
Rene Weber
ISBN: 146521223X, 978-1465212238
$201.6 $288.00

Napoleon Hills Golden Classics Featuring Think And Grow Rich The Law Of Success And The Master Key To Riches Featuring Think Law Of Success And The Master Key To Riches - Abridged Edition
Napoleon Hill
ISBN: 1722500891, 978-1722500894
$0 $14.35
Metodologa A De La Investigacia N - 1st Edition
Hernandez
ISBN: 6071502918, 978-6071502919
$0 $45.95
Optimizing Organizations Reinvention Through People Adapted Mindsets And The Dynamics Of Change - 1st Edition
Jonathan H Westover
ISBN: B0DFLYZ1TX, 979-8337592534
$0 $24.98
The Complete Idiots Guide To Managing Your Money - 1st Edition
Robert K Heady
ISBN: 1592572987, 978-1592572984
$0 $6.25
A Refresher In Financial Accounting - 1st Edition
Faisal Sheikh
ISBN: 1631579266, 9781631579264
$0 $32.00Recommended For You (10)

Harnessing The Wind For Home Energy By Mcguigan Dermot Paperback - 1st Edition
Dermot Mcguigan
ISBN: 0882661183, 978-0882661186
$0 $29.39
Geometry A Quickstudy Laminated Reference Guide - 1st Edition
Peggy Warren
ISBN: 1423247264, 978-1423247265
$0 $5.23
Math Fundamentals 1 Number Sense And Operations - 2nd Edition
Peggy Warren
ISBN: 1423247248, 9781423247241
$0 $6.46
Chefs Guide To Herbs And Spices A Quickstudy Laminated Reference Guide - 1st Edition
Chef Jay Weinstein
ISBN: 1423239776, 978-1423239772
$0 $5.23
Diabetes Care Management And Prevention A Quickstudy Laminated Reference Guide - 1st Edition
Jodi Mccaffrey Fache
ISBN: 1423244176, 978-1423244172
$0 $5.23
Annual Report Of The Division Of Vital Statistics Of The Department Of Public Health Province Of Alberta 1954 - 1st Edition
Alberta Vital Statistics Branch
ISBN: 101475965X, 978-1014759658
$0 $15.95
Yearbook Of Fishery Statistics 2003 - 1st Edition
Food And Agriculture Organization Of The United Nations
ISBN: 9250053355, 978-9250053356
$0 $62.41
Zero To One The $100 Startup You Are A Badass At Making Money 3 Books Collection Set - 1st Edition
Jen Sincero
ISBN: 9123553715, 978-9123553716
$0 $37.00
Getting To Us How Great Coaches Make Great Teams - 1st Edition
Seth Davis
ISBN: 073522272X, 978-0735222724
$0 $9.60