

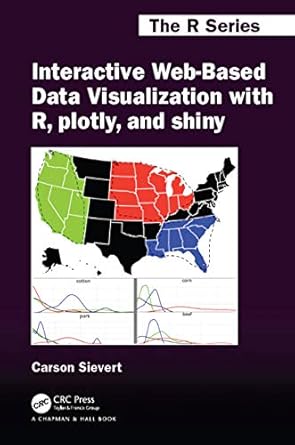
Interactive Web Based Data Visualization With R Plotly And Shiny(1st Edition)
Authors:
Carson Sievert
In Stock: 2 Left
Shipment time
Expected shipping within 2 - 3 DaysPopular items with books
Total Price:
$0
Solution Manual Includes
Price:
$9.99
Book details
ISBN: 1138331457, 978-1138331457
Book publisher: Chapman and Hall/CRC
Book Price $0 : The Richly Illustrated Interactive Web-Based Data Visualization With R, Plotly, And Shiny Focuses On The Process Of Programming Interactive Web Graphics For Multidimensional Data Analysis. It Is Written For The Data Analyst Who Wants To Leverage The Capabilities Of Interactive Web Graphics Without Having To Learn Web Programming. Through Many R Code Examples, You Will Learn How To Tap The Extensive Functionality Of These Tools To Enhance The Presentation And Exploration Of Data. By Mastering These Concepts And Tools, You Will Impress Your Colleagues With Your Ability To Quickly Generate More Informative, Engaging, And Reproducible Interactive Graphics Using Free And Open Source Software That You Can Share Over Email, Export To Pdf, And More.Key Features:Convert Static Ggplot2 Graphics To An Interactive Web-based FormLink, Animate, And Arrange Multiple Plots In Standalone HTML From REmbed, Modify, And Respond To Plotly Graphics In A Shiny AppLearn Best Practices For Visualizing Continuous, Discrete, And Multivariate DataLearn Numerous Ways To Visualize Geo-spatial DataThis Book Makes Heavy Use Of Plotly For Graphical Rendering, But You Will Also Learn About Other R Packages That Support Different Phases Of A Data Science Workflow, Such As Tidyr, Dplyr, And Tidyverse. Along The Way, You Will Gain Insight Into Best Practices For Visualization Of High-dimensional Data, Statistical Graphics, And Graphical Perception. The Printed Book Is Complemented By An Interactive Website Where Readers Can View Movies Demonstrating The Examples And Interact With Graphics.
Customers also bought these books (16)

Library Information Systems - 2nd Edition
Joseph R. Matthews
ISBN: 1440851948, 978-1440851940
$0 $46.72
Modeling Methodology For Physiology And Medicine - 2nd Edition
Ewart Carson
ISBN: 0124115578,0124095259
$59.5 $85.00
Database System Concepts - 4th Edition
Henry F. Korth
ISBN: 978-0073523323, 0-07-255481-9, 73523321, 978-0072554816
$0 $44.02
University Physics with Modern Physics - 12th Edition
Hugh D. Young
ISBN: 978-0321501479, 9780805321876, 321501470, 978-0321501219
$0 $24.30
Insect Biochemistry And Molecular Biology Experimental Techniques - 1st Edition
Cao Chuan Wang Gao Cai Qiu
ISBN: 7811314924, 978-7811314922
$0 $39.05
Markov Random Field Modeling In Image Analysis - 3rd Edition
Stan Z Li
ISBN: 1849967679, 978-1849967679
$85.12 $121.60
Handbook Of Scheduling Algorithms Models And Performance Analysis - 1st Edition
Joseph Y T Leung
ISBN: 1584883979, 978-1584883975
$95.9 $137.00
Handbook Of Spatial Epidemiology - 1st Edition
Andrew B Lawson
ISBN: 1482253011, 978-1482253016
$96.83 $138.33
Inference And Disputed Authorship - New Edition
Frederick Mosteller
ISBN: 1575865521, 978-1575865522
$0 $22.35
Financial Analysis With Python A Hands On Guide To Modeling Prediction And Automation - 1st Edition
Ahmed Khorshid
ISBN: B0DF38J5ZJ
$0 $9.99
My First Time In Hollywood Stories From The Pioneers Dreamers And Misfits Who Made The Movies - 1st Edition
Cari Beauchamp
ISBN: 1940412145, 978-1940412146
$0 $17.50
Deep Credit Risk Machine Learning With Python - 1st Edition
Daniel Rosch
ISBN: 979-8617590199
$0 $69.00

Supercharge Your Notary Business With Linkedin How Mobile Notaries And Loan Signing Agents Build Their Brand Get Known And Connect With Their Dream Clients - 1st Edition
Bill Soroka
ISBN: 1734183314, 978-1734183313
$0 $12.00
Labster Virtual Lab Experiments Basic Biochemistry - 1st Edition
Aaron Gardner
ISBN: 3662584980, 978-3662584989
$0 $19.99
Cell And Molecular Biology Of Endometrial Carcinoma - 2003rd Edition
H Kuramoto
ISBN: 4431006133, 978-4431006138
$85.94 $122.77Popular Among Students (12)

Computer Relaying For Power Systems - 2nd Edition
Arun G. Phadke
ISBN: 0470057130, 978-0470057131
$83.99 $119.99

Electric Power System Reliability 2023 - 1st Edition
William H. Smith
ISBN: 069294589X, 978-0692945896
$87.5 $125.00
Order Statistics Records And Generalized Order Statistics New Aspects Characterization Moments And Their Applications - 1st Edition
HASAN MATEEN-UL ISLAM
ISBN: 3843379432, 978-3843379434
$0 $63.72
Exploring General Organic And Biochemistry In The Laboratory - 1st Edition
William G. O'Neal
ISBN: 1617316180, 978-1617316180
$66.5 $95.00
An Open Life Joseph Campbell In Conversation With Michael Toms - 1st Edition
Michael Toms
ISBN: 0060972955, 978-0060972950
$0 $7.45
A Descriptive And Statistical Gazetteer Of The United States Of America -
Haskel
ISBN: 1169372686, 9781169372689
$0 $32.00
Inferences Using Censored Samples And Record Values From Burr Xii Estimation Prediction Bayesian And Non Bayesian Approaches - 1st Edition
Abdullah Modhesh
ISBN: 3659282650, 978-3659282652
$61.6 $88.00
Causal Inference With Bayesian Networks Exploring The Practical Applications And Demonstrations Of Causal Inference Using R And Python - 1st Edition
Yousri El Fattah
ISBN: 1835084982, 978-18350849841835084982,978-1835084984
$0 $43.43
The Responsible Leader Developing A Culture Of Responsibility In An Uncertain World - 1st Edition
Tim Richardson
ISBN: 0749471816, 0749471824, 9780749471811, 9780749471828
$66.63 $95.18
Beyond The Myths And Magic Of Mentoring How To Facilitate An Effective Mentoring Process - 1st Edition
Margo Murray
ISBN: 0787956759, 978-0787956752
$0 $10.09
Financial Management Theory And Practice - 11th Edition
Eugene F Brigham
ISBN: 0324259689, 9780324259681
$0 $16.72