

Question: The data in the following table represent the number of hours of relief provided by 5 different brands of headache tablets administered to 25 subjects
The data in the following table represent the number of hours of relief provided by 5 different brands of headache tablets administered to 25 subjects experiencing fevers of 38?C or more. Perform the: analysis of variance and test the hypothesis at the 0.05 level of significance that, the mean number of hours of relief provided by the tablets is the same for all 5 brands. Discuss theresults.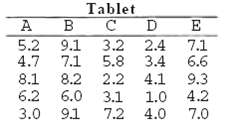
Tablet A 5.2 9.1 3.2 2.4 7.1 4.7 7.1 5.8 3.4 6.6 8.1 8.2 2.2 6.2 4.1 9.3 6.0 3.1 1.0 4.2 3.0 9.1 7.2 4.0 7.0
Step by Step Solution
3.29 Rating (167 Votes )
There are 3 Steps involved in it
The hypotheses are Ho 1 2 fl5 H At least two of the means are not equal 005 C... View full answer

Get step-by-step solutions from verified subject matter experts
Document Format (1 attachment)
18-M-S-F-E (4).docx
120 KBs Word File