

Question: The data in the table below represent warehouse club and superstore sales in the United States on a monthly basis. a. Prepare a time-series plot
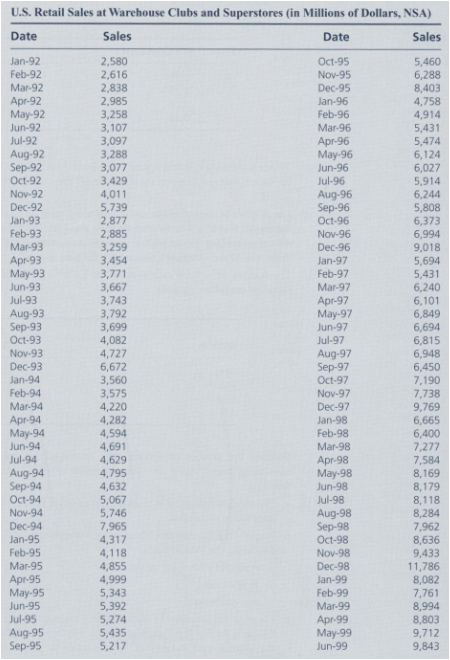
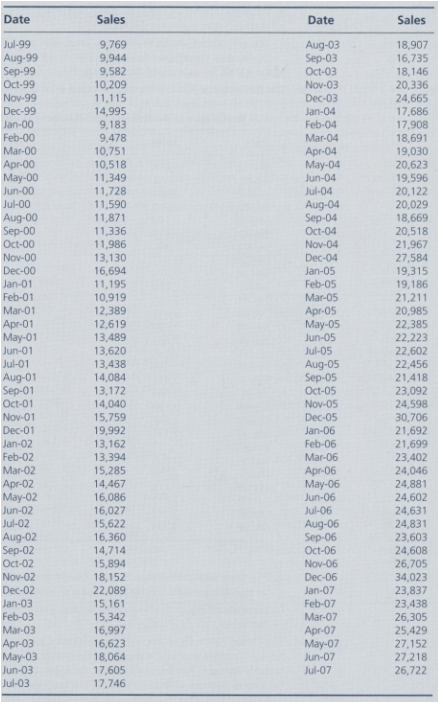
a. Prepare a time-series plot of the data, and visually inspect that plot to determine the characteristics you see in this series.
b. Use a smoothing model to develop a forecast of sales for the next 12 months, and explain why you selected that model. Plot the actual and forecast values. Determine the RMSE for your model during the historical period.
U.S. Retail Sales at Warehouse Clubs and Superstores (in Millions of Dollars, NSA) Date Sales Date Sales Jan-92 2,580 Oct-95 Nov-95 5,460 6,288 8,403 4,758 Feb-92 Mar-92 2,616 2,838 2,985 Dec-95 Jan-96 Apr-92 May-92 Jun-92 Jul-92 3,258 3,107 3,097 3,288 3,077 3,429 4,011 Feb-96 4,914 5,431 5,474 Mar-96 p-96 May-96 Jun-96 Jul-96 Aug-92 Sep-92 Oct-92 6,124 6,027 5,914 6,244 Nov-92 Aug-96 Sep-96 Oct-96 Dec-92 5,739 2,877 2,885 3,259 3,454 3,771 3,667 3,743 3,792 3,699 4,082 5,808 6,373 6,994 Jan-93 Feb-93 Nov-96 Mar-93 Dec-96 9,018 5,694 5,431 6,240 6,101 6,849 6,694 6,815 6,948 6,450 7,190 Apr-93 May-93 Jan-97 Feb-97 Jun-93 Mar-97 Jul-93 Apr-97 May-97 Aug-93 Sep-93 Oct-93 Nov-93 Dec-93 Jan-94 Jun-97 Jul-97 4,727 6,672 3,560 Aug-97 Sep-97 Oct-97 Feb-94 3,575 4,220 4,282 4,594 4,691 4,629 4,795 4,632 Nov-97 Dec-97 7,738 9,769 6,665 6,400 7,277 Mar-94 Jan-98 Feb-98 Mar-98 p-94 May-94 Jun-94 Jul-94 Apr-98 May-98 Jun-98 7,584 8,169 8,179 Aug-94 Sep-94 Oct-94 5,067 5,746 Jul-98 Aug-98 Sep-98 Oct-98 Nov-98 Dec-98 8,118 8,284 7,962 8,636 9,433 Nov-94 Dec-94 7,965 4,317 4,118 4,855 Jan-95 Feb-95 Mar-95 11,786 8,082 7,761 8,994 8,803 Jan-99 Feb-99 Apr-95 May-95 4,999 5,343 5,392 5,274 5,435 5,217 Jun-95 Mar-99 p-99 May-99 Jun-99 Jul-95 Aug-95 Sep-95 9,712 9,843
Step by Step Solution
3.66 Rating (172 Votes )
There are 3 Steps involved in it
tr msoheightsourceauto col msowidthsourceauto br msodataplacementsamecell style0 msonumberformatGeneral textaligngeneral verticalalignbottom whitespacenowrap msorotate0 msobackgroundsourceauto msopatt... View full answer

Get step-by-step solutions from verified subject matter experts
Document Format (1 attachment)
647-M-S-L-R (6205).xlsx
300 KBs Excel File