

The DeBourgh Manufacturing Company was founded in 1909 as a metal-fabricating company in Minnesota by the four
Question:
Discussion
1. After its move in 1990 to La Junta, Colorado, and its new initiatives, the DeBourgh Manufacturing Company began an upward climb of record sales. Suppose the figures shown here are the DeBourgh monthly sales figures from January 2001 through December 2009 (in $1,000s). Are any trends evident in the data? Does DeBourgh have a seasonal component to its sales? Shown after the sales figures is Minitab output from a decomposition analysis of the sales figures using 12-month seasonality.
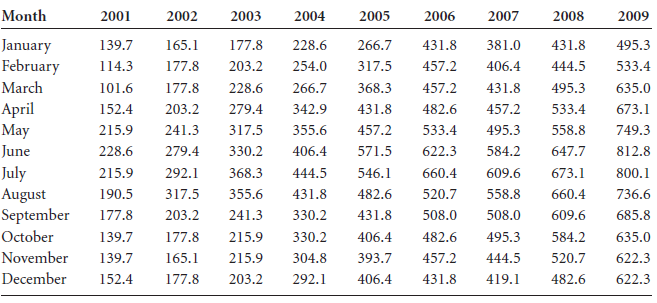
Next an Excel graph displays the data with a trend line. Examine the data, the output, and any additional analysis you feel is helpful, and write a short report on DeBourgh sales.
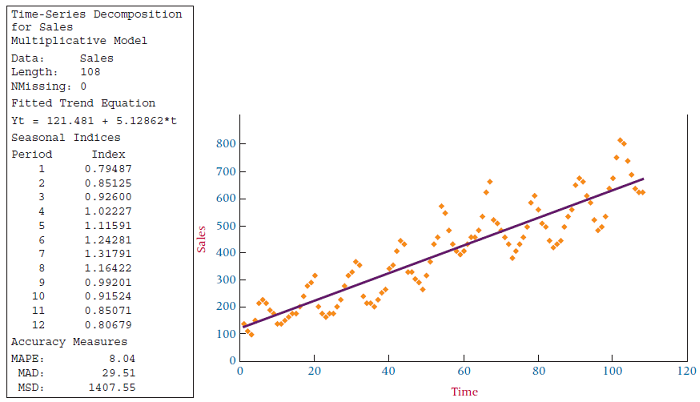
Include a discussion of the general direction of sales and any seasonal tendencies that might be occurring.
2. Suppose DeBourgh accountants computed a per-unit cost of lockers for each year since 1996, as reported here. Use techniques in this chapter to analyze the data. Forecast the per-unit labor costs through the year 2009. Use smoothing techniques, moving averages, trend analysis, and any others that seem appropriate. Calculate the error of the forecasts and determine which forecasting method seems to do the best job of minimizing error. Study the data and explain the behavior of the per-unit labor cost since 1996.
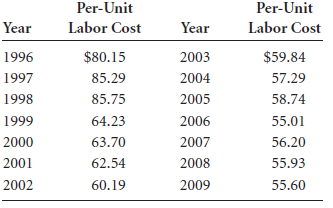
Think about the company history and objectives since 1996.
Step by Step Answer:
1 The decomposition analysis shows several things A study of the original data shows that there is a general upward trend This is underscored by the g...View the full answer


Business Statistics for Contemporary Decision Making
ISBN: 978-0470910184
6th Edition
Authors: Ken Black
