

Question: The following chart shows three different costs: Cost A, Cost B, and Cost C. For each cost, the chart shows the total cost and cost
The following chart shows three different costs: Cost A, Cost B, and Cost C. For each cost, the chart shows the total cost and cost per unit at two different volumes within the same relevant range. Based on this information, identify each cost as fixed, variable, or mixed. Explain youranswers.
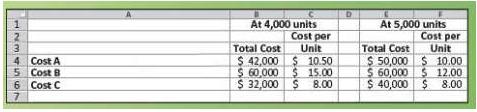
At 4,000 units At 5,000 units Cost per Cost per Total CostUnit Total Cost Unit 4 Cost A Cost B 6 Cost C 42,000 10.50 $50,000 10.00 60,000 S 12.00 $40,000 $ 8.00 60,000 15.00 32,000 8.00
Step by Step Solution
3.32 Rating (170 Votes )
There are 3 Steps involved in it
Cost A is a mixed cost Total costs are not constant and the per un... View full answer

Get step-by-step solutions from verified subject matter experts
Document Format (1 attachment)
322-B-M-A-C-B (851).docx
120 KBs Word File