

The following cost graphs illustrate various types of cost behavior: For each of the following costs, identify
Question:
The following cost graphs illustrate various types of cost behavior:
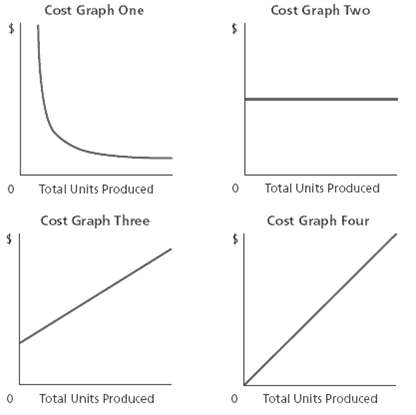
For each of the following costs, identify the cost graph that best illustrates its cost behavior as the number of units produced increases.a. Total direct materials costb. Electricity costs of $2,000 per month plus $0.09 per kilowatt-hourc. Per-unit direct labor costd. Salary of quality control supervisor, $10,000 per monthe. Per-unit cost of straight-line depreciation on factoryequipment
Fantastic news! We've Found the answer you've been seeking!
Step by Step Answer:
a Cost Graph Four ...View the full answer

Answered By
David Ngaruiya
i am a smart worker who concentrates on the content according to my clients' specifications and requirements.
7+ Reviews
19+ Question Solved
Related Book For 

Accounting
ISBN: 978-0324662962
23rd Edition
Authors: Jonathan E. Duchac, James M. Reeve, Carl S. Warren
Question Posted:
