

The following data represent petal lengths (in cm) for independent random samples of two species of iris
Question:
The following data represent petal lengths (in cm) for independent random samples of two species of iris (Reference: E. Anderson, Bulletin American Iris Society). Note: These data are also available for download at the Companion Sites for this text.
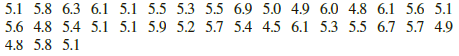
Petal length (in cm) of Iris virginica: x1; n1 = 35
Petal length (in cm) of Iris setosa: x2; n2 = 38
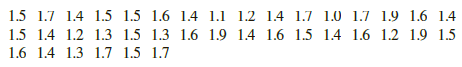
(a) Use a calculator with mean and standard deviation keys to verify that x̅1 » 5.48, s1 » 0.55, x̅2 » 1.49, and s2 » 0.21.
(b) Let m1 be the population mean for x1 and let m2 be the population mean for x2. Find a 99% confidence interval for m1 – m2.
(c) Interpretation Explain what the confidence interval means in the context of this problem. Does the interval consist of numbers that are all positive? all negative? of different signs? At the 99% level of confidence, is the population mean petal length of Iris virginica longer than that of Iris setosa’.
(d) Check Requirements Which distribution (standard normal or Student’s t) did you use? Why? Do you need information about the petal length distributions? Explain.
DistributionThe word "distribution" has several meanings in the financial world, most of them pertaining to the payment of assets from a fund, account, or individual security to an investor or beneficiary. Retirement account distributions are among the most...
Step by Step Answer:
a Using a calculator the means and standard deviati...View the full answer


Understandable Statistics Concepts And Methods
ISBN: 9781337119917
12th Edition
Authors: Charles Henry Brase, Corrinne Pellillo Brase
