

Question: The following data represent the afternoon high temperatures for 50 construction days during a year in St.Louis. a. Construct a frequency distribution for the data
The following data represent the afternoon high temperatures for 50 construction days during a year in St.Louis.
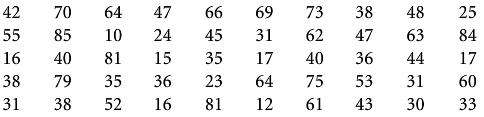
a. Construct a frequency distribution for the data using five class intervals.
b. Construct a frequency distribution for the data using 10 class intervals.
c. Examine the results of (a) and (b) and comment on the usefulness of the frequency distribution in terms of temperature summarization capability.
54703 28163 83410 46433 87633 34354 32051 76476 91742 63161 65531 64328 74566 42131 40152 61835 05098 78473 25681 45133
Step by Step Solution
3.31 Rating (178 Votes )
There are 3 Steps involved in it
a One possible 5 class frequency distribution Class Interval Frequency 0 Under 20 7 20 Un... View full answer

Get step-by-step solutions from verified subject matter experts
Document Format (1 attachment)
409-M-S-D-A (344).docx
120 KBs Word File