

Question: The following data sets give the driving speeds in miles per hour of the first nine cars to pass through a school zone and the
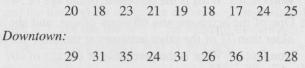
The following data sets give the driving speeds in miles per hour of the first nine cars to pass through a school zone and the first nine cars to pass through a downtown intersection.
a. Find the mean, median, and range for each of the two data sets.
b. Give the five-number summary and draw a boxplot for each of the two data sets.
c. Find the standard deviation for each of the two data sets.
d. Apply the range rule of thumb to estimate the standard deviation of each of the two data sets. How well does the rule work in each case? Briefly discuss why it does or does not work well.
20 18 23 21 19 18 17 24 25 Downtown 29 31 35 24 31 26 36 31 28
Step by Step Solution
3.37 Rating (166 Votes )
There are 3 Steps involved in it
a b c Using Excel we find that the standard deviations are 29 mph for t... View full answer

Get step-by-step solutions from verified subject matter experts
Document Format (1 attachment)
666-M-S-D-A (5677).docx
120 KBs Word File