

Question: The following data show the average monthly utility bills for a random sample of households in Baltimore and for a random sample of households in
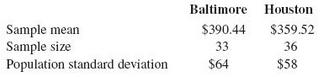
The following data show the average monthly utility bills for a random sample of households in Baltimore and for a random sample of households in Houston. (The bills include phone, television, Internet, electricity, and natural gas.)
a. Perform a hypothesis test using α = 0.05 to determine if there is a difference between the mean utility bills in these two cities.
b. Determine the p value and interpret the results.
c. Verify your results using PHStat.
Baltimore Houston $390.44 $359.52 Sample mean Sample size 36 $58 Population standard deviation $64
Step by Step Solution
3.44 Rating (170 Votes )
There are 3 Steps involved in it
a b c Ho 14120 H1 M I2 ... View full answer

Get step-by-step solutions from verified subject matter experts
Document Format (1 attachment)
483-M-S-H-T (1531).docx
120 KBs Word File