

Question: The following information was reported by Gap, Inc. in its 2009 annual report. (a) Determine the overall percentage decrease in Gap's total assets from 2005
The following information was reported by Gap, Inc. in its 2009 annual report.
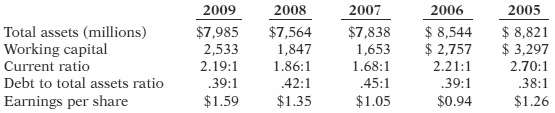
(a) Determine the overall percentage decrease in Gap's total assets from 2005 to 2009. What was the average decrease per year?(b) Comment on the change in Gap's liquidity. Does working capital or the current ratio appear to provide a better indication of Gap's liquidity? What might explain the change in Gap's liquidity during this period?(c) Comment on the change in Gap's solvency during this period.(d) Comment on the change in Gap's profitability during this period. How might this affect your prediction about Gap's futureprofitability?
2009 $7,985 2,533 2.19:1 .39:1 $1.59 2008 $7,564 1,847 2007 $7,838 1,653 2006 2005 Total assets (millions) Working capital Current ratio Debt to total assets ratio Earnings per share $ 8,544 $ 8,821 $ 2,757 2.21:1 $ 3,297 2.70:1 1.86:1 1.68:1 .45:1 .39:1 $0.94 42:1 $1.35 38:1 $1.26 $1.05
Step by Step Solution
3.44 Rating (167 Votes )
There are 3 Steps involved in it
a The percentage decrease in Gaps total assets during this period is calculated as 798588218821 95 T... View full answer

Get step-by-step solutions from verified subject matter experts
Document Format (1 attachment)
48-B-A-F-S (270).docx
120 KBs Word File