

Question: The following scatter plot and simple regression results used revenue as a potential cost driver for research and development costs. SUMMARY OUTPUT Regression Statistics Multiple
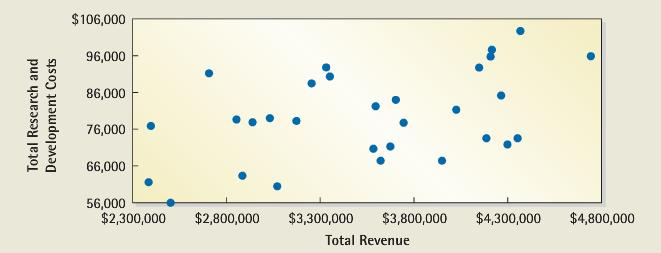
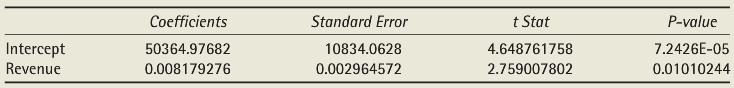
The following scatter plot and simple regression results used revenue as a potential cost driver for research and development costs.
SUMMARY OUTPUT
Regression Statistics
Multiple R ……………....…. 0.462332038
R Square ……………….....… 0.213750914
Adjusted R Square ……… 0.185670589
Standard Error ………….... 10894.44062
Observations …………...… 30
REQUIRED
A. Discuss whether the scatter plot suggests that revenue is a cost driver for research and development costs
B. Using the regression results, write the cost function for research and development costs.
C. Based on the regression results, discuss whether it would be appropriate to use total revenue as a cost driver for research and development costs.
D. If you use the cost function from part (B) to estimate next month’s research and development costs, what assumptions are you making? Identify at least three assumptions and discuss their reasonableness.
$106,000 96,000 86,000 aS76,000 66,000 56,000 $2,300,000 $2,800,000 $3,300,000 $3,800,000 $4,300,000 $4,800,000 Total Revenue Coefficients 50364.97682 0.008179276 Standard Error 10834.0628 0.002964572 t Stat 4.648761758 2.759007802 P-value 7.2426E-05 0.01010244 Intercept Revenue
Step by Step Solution
3.40 Rating (159 Votes )
There are 3 Steps involved in it
A The plot shows costs that are widely scattered However there does appear to be a general upward tr... View full answer

Get step-by-step solutions from verified subject matter experts
Document Format (1 attachment)
392-B-M-A-C-M (908).docx
120 KBs Word File