

The graph in Figure 3.22 shows home prices in different regions of the United States. Note that
Question:
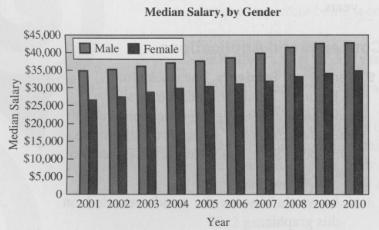
The graph in Figure 3.22 shows home prices in different regions of the United States. Note that the data have not been adjusted for the effects of inflation.
a. In words, describe the general trends that apply to the home price data for all regions.
b. In words, describe any differences that you notice among the different regions.
Figure 3.22
Fantastic news! We've Found the answer you've been seeking!
Step by Step Answer:
a Home prices have generally risen in all regions until around ...View the full answer

Answered By
Lisper Wanja
I am an experienced and highly motivated writer with a passion for the skills listed. I have a proven track record of my expertise and my aim is to deliver quality, well-detailed and plagiarism free projects. My genuine passion for writing combined with my ongoing professional development through school and research makes me an ideal candidate within for any assignment.
233+ Reviews
388+ Question Solved
Related Book For 

Statistical Reasoning for Everyday Life
ISBN: 978-0321817624
4th edition
Authors: Jeff Bennett, Bill Briggs, Mario F. Triola
Question Posted:
