

Question: The graph shown here represents the probability distribution for the number of girls in a family of three children. From this graph, construct a probability
The graph shown here represents the probability distribution for the number of girls in a family of three children. From this graph, construct a probability distribution.
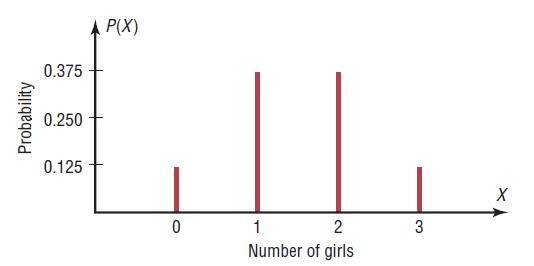
P(X) 0.375 0.250 0.125 Number of girls
Step by Step Solution
★★★★★
3.52 Rating (159 Votes )
There are 3 Steps involved in it
1 Expert Approved Answer
Step: 1 Unlock

X 0 PX ... View full answer
Question Has Been Solved by an Expert!
Get step-by-step solutions from verified subject matter experts
Step: 2 Unlock
Step: 3 Unlock
Document Format (1 attachment)
504-M-S-D-P-D (928).docx
120 KBs Word File