

The hydrocarbon emissions at idling speed in parts per million (ppm) for automobiles of 1980 and 1990
Question:
The hydrocarbon emissions at idling speed in parts per million (ppm) for automobiles of 1980 and 1990 are given for 20 randomly selected cars.
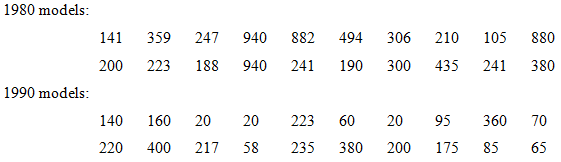
(a) Construct a dot plot as in Figure 1.1.
(b) Compute the sample means for the two years and superimpose the two means on the plots.
(c) Comment on what the dot plot indicates regarding whether or not the population emissions changed from 1980 to 1990. Use the concept of variability in you comments.
Fantastic news! We've Found the answer you've been seeking!
Step by Step Answer:
a A dot plot is shown next 16015 8 Xxxxxx 100 200 b X1980 3951 and X1990 1602 300 39510 800 x 400 X ...View the full answer

Answered By
Muhammad Umair
I have done job as Embedded System Engineer for just four months but after it i have decided to open my own lab and to work on projects that i can launch my own product in market. I work on different softwares like Proteus, Mikroc to program Embedded Systems. My basic work is on Embedded Systems. I have skills in Autocad, Proteus, C++, C programming and i love to share these skills to other to enhance my knowledge too.
1+ Reviews
10+ Question Solved
Related Book For 
Probability & Statistics For Engineers & Scientists
ISBN: 9780130415295
7th Edition
Authors: Ronald E. Walpole, Raymond H. Myers, Sharon L. Myers, Keying
Question Posted:
