

Question: The medical facility in Exercise 27 also keeps track of the number of errors found when transcribing information from patient forms. Last year the average
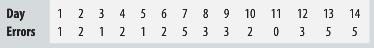
The medical facility in Exercise 27 also keeps track of the number of errors found when transcribing information from patient forms. Last year the average number of errors was 1.26 per day which the facility found acceptable. Here are the past two weeks€™ data:
Based on last year, using a c chart:
a)€‚What is the center line?
b)€‚Calculate the upper control limit.
c)€‚Calculate the lower control limit.
d)€‚Create the c chart for this two-week period.
e)€‚Is this process out of control?
Day 2 3 4 5 6 7 8 9 10 11 12 13 14 Errors 1 2 1 2 1 25 3 3 2 0 3 5 5
Step by Step Solution
3.48 Rating (171 Votes )
There are 3 Steps involved in it
a The centerline of the c chart is the average number of complaints in ... View full answer

Get step-by-step solutions from verified subject matter experts
Document Format (1 attachment)
452-M-S-Q-C-B-S (77).docx
120 KBs Word File