

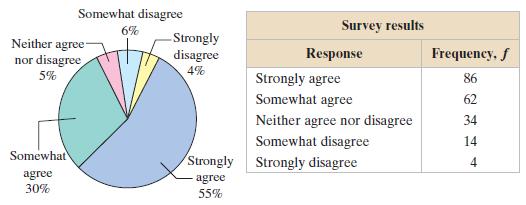
The pie chart shows the distribution of the opinions of U.S. parents on whether a college education
Question:
The pie chart shows the distribution of the opinions of U.S. parents on whether a college education is worth the expense. An economist claims that the distribution of the opinions of U.S. teenagers is different from the distribution for U.S. parents. To test this claim, you randomly select 200 U.S. teenagers and ask each whether a college education is worth the expense. The table shows the results. At α = 0.05, test the economist’s claim.
(a) Identify the expected distribution and state H0 and Ha,
(b) Find the critical value and identify the rejection region,
(c) Find the chi-square test statistic,
(d) Decide whether to reject or fail to reject the null hypothesis,
(e) Interpret the decision in the context of the original claim.
DistributionThe word "distribution" has several meanings in the financial world, most of them pertaining to the payment of assets from a fund, account, or individual security to an investor or beneficiary. Retirement account distributions are among the most...
Step by Step Answer:
a Claimed distribution H 0 The distribution of the opinions of US parent...View the full answer


Elementary Statistics Picturing The World
ISBN: 9780321911216
6th Edition
Authors: Ron Larson, Betsy Farber
