

Question: The Poisson distribution (Section 5.4) gives the probability for the number of occurrences for a rare event. Now, let x be a random variable that
The Poisson distribution (Section 5.4) gives the probability for the number of occurrences for a “rare” event. Now, let x be a random variable that represents the waiting time between rare events. Using some mathematics, it can be shown that x has an exponential distribution. Let x > 0 be a random variable and let β > 0 be a constant. Then y = 1/ βe–x/β is a curve representing the exponential distribution. Areas under this curve give us exponential probabilities.
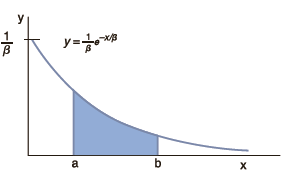
If a and b are any numbers such that 0 6 a 6 b, then using some extra mathematics, it can be shown that the area under the curve above the interval [a, b] is
P(a < x < b) = e – a/β – e–b/β
Notice that by definition, x cannot be negative, so, P(x < 0) = 0. The random variable x is called an exponential random variable. Using some more mathematics, it can be shown that the mean and standard deviation of x are
m = β and s = β
The number e = 2.71828 . . . is used throughout probability, statistics and mathematics. The key ex is conveniently located on most calculators.
The Poisson and exponential distributions have a special relationship. Specifically, it can be shown that the waiting time between successive Poisson arrivals (i.e., successes or rare events) has an exponential distribution with β = 1/l, where l is the average number of Poisson successes (rare events) per unit of time. For more on this topic, please see Problem 20.
Fatal accidents on scheduled domestic passenger flights are rare events. In fact, airlines do all they possibly can to prevent such accidents. However, around the world such fatal accidents do occur. Let x be a random variable representing the waiting time between fatal airline accidents. Research has shown that x has an exponential distribution with a mean of approximately 44 days (Reference: R. Pyke,
“Spacings,” Journal of the Royal Statistical Society B, Vol. 27, No. 3, p. 426.)
We take the point of view that x (measured in days as units) is a continuous random variable. Suppose a fatal airline accident has just been reported on the news. What is the probability that the waiting time to the next reported fatal airline accident is
(a) Less than 30 days (i.e., 0 ≤ x < 30)?
(b) More than 50 days (i.e., 50 ≤ x < ∞)?
(c) Between 20 and 60 days?
(d) What are the mean and the standard deviation of the waiting times x?
-o a
Step by Step Solution
3.51 Rating (168 Votes )
There are 3 Steps involved in it
a b c d B... View full answer

Get step-by-step solutions from verified subject matter experts
Document Format (1 attachment)
1275-M-S-P-E(1341).docx
120 KBs Word File