

Question: The same poll as in Exercise has asked about social networking over several years and for different age groups. Here is a table of responses:
The same poll as in Exercise has asked about social networking over several years and for different age groups.
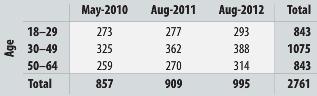
Here is a table of responses:
a) Under the usual null hypothesis, what are the expected values?
b) Compute the x2 statistic.
c) How many degrees of freedom does it have?
d) What do you conclude?
18-29 30-49 50-64 Total May-2010 Aug-2011 Aug-2012 Total 843 1075 843 995 2761 273 325 259 857 277 362 270 909 293 388 314
Step by Step Solution
3.45 Rating (171 Votes )
There are 3 Steps involved in it
a The expected values under the null hypothesis are shown in the table below Age May20... View full answer

Get step-by-step solutions from verified subject matter experts
Document Format (1 attachment)
452-M-S-S-I (789).docx
120 KBs Word File