

Question: The stratification calculation example in the chapter shows the results of calculating the projected likely misstatement using the difference method. Assume the results shown in
The stratification calculation example in the chapter shows the results of calculating the projected likely misstatement using the difference method. Assume the results shown in Exhibit EP 10-5 were obtained from a stratified sample.
Required:
Apply the ratio calculation method to each stratum to calculate the projected likely misstatement (PLM). What is PLM for the entire sample?
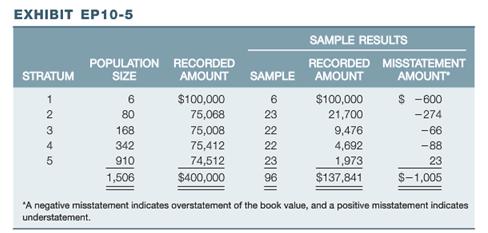
EXHIBIT EP10-5 SAMPLE RESULTS POPULATION RECORDED SIZE RECORDED MISSTATEMENT AMOUNT STRATUM AMOUNT SAMPLE AMOUNT $100,000 75,068 1 6 6 $100,000 $ -600 2 80 23 21,700 -274 168 75,008 75,412 22 9,476 4,692 1,973 -66 342 22 -88 74,512 $400,000 910 23 23 1,506 96 $137,841 $-1,005 "A negative misstatement indicates overstatement of the book value, and a positive misstatement indicates understatement.
Step by Step Solution
3.47 Rating (157 Votes )
There are 3 Steps involved in it
Stratified Calculation of Projected Likely Misstatement Using the Ratio Method Sample Results Rec... View full answer

Get step-by-step solutions from verified subject matter experts
Document Format (1 attachment)
383-B-A-A-P (1340).docx
120 KBs Word File