

Question: The table below shows the annual change in the average U.S. home price from 2005 to 2014 according to the S&P/Case-Shiller Index. Calculate the average
The table below shows the annual change in the average U.S. home price from 2005 to 2014 according to the S&P/Case-Shiller Index. Calculate the average annual return and its standard deviation. Compare this to the average return and standard deviation for Target Corporation and American Eagle Outfitters, Inc., shown in Table 4.9. In terms of average return and standard deviation, how does residential real estate compare as an investment relative to those two common stocks?
Year __________% Change
2005 ................... 15.5%
2006 .................... 0.7%
2007 .................. - 9.0%
2008 ................. - 18.6%
2009 .................. - 3.1%
2010 .................. - 2.4%
2011 .................. - 4.1%
2012 ................... 6.9%
2013 .................. 13.4%
2014 ................... 4.5%
Data from Table 4.9
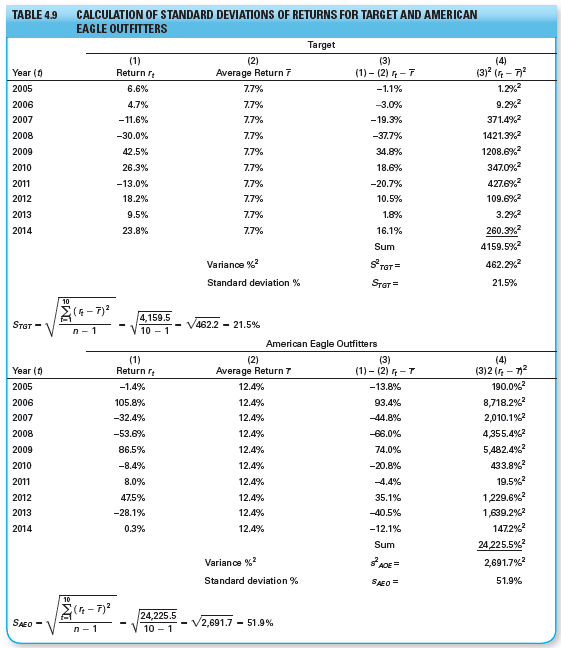
CALCULATION OF STANDARD DEVIATIONS OF RETURNS FOR TARGET AND AMERICAN EAGLE OUTFITTERS TABLE 4.9 Target (1) Return r (2) (3) (4) (3)? (r - 7 1.2% 9.2%? Year (0 Average Return 7 (1) - (2) -7 2005 6.6% 7.7% -1.1% 2006 4.7% 7.7% -3.0% 371.4% 2007 -11.6% 7.7% -19.3% 1421.3% 2008 -30.0% 7.7% -37.7% 1208.6% 2009 42.5% 7.7% 34.8% 347.0% 18.6% 2010 26.3% 7.7% 427.6% 2011 -13.0% 7.7% -20.7% 109.6%? 2012 18.2% 7.7% 10.5% 3.2% 2013 9.5% 7.7% 1.8% 260.3% 23.8% 2014 7.7% 16.1% 4159.5% Sum Variance % 462.2% TGT= Standard deviation % Srar = 21.5% 10 4,159.5 10 - 1 462.2 21.5% STAT - American Eagle Outfitters (1) Return re (2) (3) (1) - (2) -T (4) (3)2 (r - n2 190.0%? Year (0 Average Return 7 2005 -1.4% 12.4% -13.8% 8,718.2%? 2,010.1%? 12.4% 2006 105.8% 93.4% 2007 -32.4% 12.4% -44.8% -53.6% -66.0% 4,355.4%? 2008 12.4% 5,482.4%? 2009 86.5% 12.4% 74.0% 433.8% 2010 -8.4% 12.4% -20.8% 19.5% 2011 8.0% 12.4% -4.4% 1229.6%? 2012 47.5% 12.4% 35.1% 1,639.2% 147.2%? 12.4% 2013 -28.1% -40.5% 2014 0.3% 12.4% -12.1% 24,225.5% Sum ADE= 2,691.7%? Variance %? Standard deviation % 51.9% SAEO = 10 24,225.5 V2,691.7 - 51.9% SAEO - 10 - 1
Step by Step Solution
3.41 Rating (160 Votes )
There are 3 Steps involved in it
The average annual return percentage change in the SPCaseShiller Index is 04 To calculate the st... View full answer

Get step-by-step solutions from verified subject matter experts
Document Format (1 attachment)
1136-B-C-F-B-V(1620).docx
120 KBs Word File