

Question: The table shows Minitab descriptive statistics for the years of education for the fathers and mothers of students in one of the authors statistics classes
The table shows Minitab descriptive statistics for the years of education for the fathers and mothers of students in one of the author€™s statistics classes and in one of her pre-algebra classes. Twelve years is equivalent to a high school education.
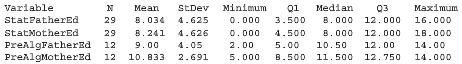
a. Are the means higher for those in pre-algebra or those in statistics?
b. In pre-algebra, is the mean higher for the mothers or the fathers?
c. Which of the four groups has the smallest standard deviation (StDev)?
Mean StDev Ninimum Median 3Maximum Variable StatFatherEd StatNotherEd 29B.241 4.626 .000 4.500D 8. 000 12. 000 1B.000 PreAlgFatherEd 12 9.00 4.05 PreAlgMotherEd 12 10.833 2.691 .000 B.500 11.500 12.750 14.000 29 B. 034 4.625 .000 3.500 000 12:000 16.000 2.00 5.00 1D.5012.00 11.00
Step by Step Solution
3.46 Rating (159 Votes )
There are 3 Steps involved in it
a The means for those in prealgebra 9 and 108 were hig... View full answer

Get step-by-step solutions from verified subject matter experts
Document Format (1 attachment)
484-M-S-D-A (2291).docx
120 KBs Word File