

Question: There are many problems, particularly in industrial applications, in which we are interested in the proportion of a population that lies between certain limits. Such
There are many problems, particularly in industrial applications, in which we are interested in the proportion of a population that lies between certain limits. Such limits are called tolerance limits. The following steps lead to the sampling distribution of the statistic P, which is the proportion of a population (having a continuous density) that lies between the smallest and the largest values of a random sample of size n.
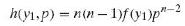
(a) Use the formula for the joint density of Y1 and Yn shown in Exercise 8.52 and the transformation technique of Section 7.4 on page 215 to show that the joint density of Y1 and P, whose values are given by
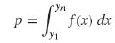
Is
(b) Use the result of part (a) and the transformation technique of Section 7.4 to show that the joint density of P and W, whose values are given by
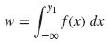
Is
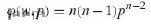
For w > 0, p > 0, w + p
(c) Use the result of part (b) to show that the marginal density of P is given by
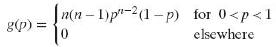
This is the desired density of the proportion of the population that lies between the smallest and the largest values of a random sample of size n, and it is of interest to note that it does not depend on the form of the population distribution.
p= | f(x) dx h(yi,p) = n(n-1)f(yi)pn-2 f(x) dx w = n(n-1)pr-2(1-p) for 0
Step by Step Solution
3.32 Rating (167 Votes )
There are 3 Steps involved in it
a b c dp f... View full answer

Get step-by-step solutions from verified subject matter experts
Document Format (1 attachment)
583-M-S-S-D (2086).docx
120 KBs Word File