

Question: This information is available for PepsiCo, Inc. for 2007, 2008, and 2009. InstructionsCalculate the inventory turnover ratio , days in inventory, and gross profit rate
This information is available for PepsiCo, Inc. for 2007, 2008, and 2009.
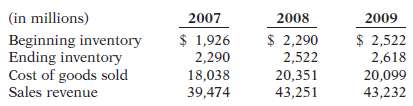
InstructionsCalculate the inventory turnover ratio, days in inventory, and gross profit rate for PepsiCo., Inc. for 2007, 2008, and 2009. Comment on any trends.
(in millions) 2009 $ 2,522 2,618 2007 $ 1,926 2,290 18,038 39,474 2008 Beginning inventory Ending inventory Cost of goods sold Sales revenue $ 2,290 2,522 20,351 43,251 20,099 43,232
Step by Step Solution
3.38 Rating (164 Votes )
There are 3 Steps involved in it
The inventory turnover ratio decreased by approximately 10 from 2007 ... View full answer

Get step-by-step solutions from verified subject matter experts
Document Format (1 attachment)
48-B-M-A-I (126).docx
120 KBs Word File