

Question: Use the financial statements on table (a) for Fox Manufacturing Company for the year ended December 31, 2009, along with the industry average ratios at
Use the financial statements on table (a) for Fox Manufacturing Company for the year ended December 31, 2009, along with the industry average ratios at the table (b), to;
Table (a)
-1.png)
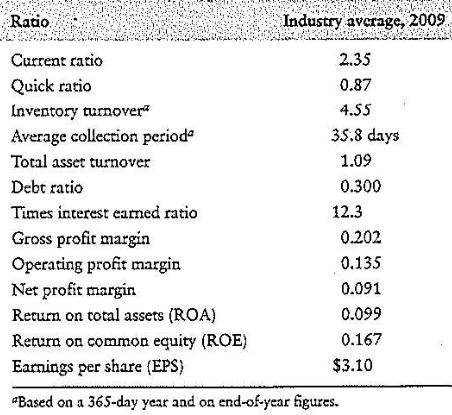
Table (b)
a. Prepare and interpret a complete ratio analysis of the firm's 2009 operations.
b. Summarize your findings and make recommendations.
Fox Manufacturing Company Income Statement for the Year Ended Deccmber 31 2009 Sales revenue Less: Cost of goods sold Gross profics Less: Operaring expenses $600,000 460,000 $140,000 General and administrative expenses $30,000 30,000 Depreciarion expense Total operating expense Operating profits Less: Irterest expense Net profits before taxes Less: Taxes Net profits after taxes (earnings available 60,000 S 80,000 10,000 S 70,000 27,100 for common stockholders) Earnings per share (EPS) 42900 $2.15 Fox Manufacturing Company Assets Cash Marketable securicies Accounts receivable Inventories $15,000 7,200 34,100 82,000 $138,300 $270,000 S408,300 Total currenc assets Ne fixed assets Total assets Liabilities and Stockholders Equity Accounts payable Notes payable Accruals S 57,000 13,000 5,000 75,000 $150,000 Total current liabilities Long-term debt Stockholders' equity Common stock equity (20,000 shares outstanding) Retained earnings $110,200 Total stockhoiders equity Total liabilities and stockholders' equity $183,300 S408,300 Raio :Industry,average, 2009.i 2.35 0.87 4.55 35.8 days Current ratio Quick ratio Inventory turnover" Average collection period Total asset turnover Debt ratio Times interest earned ratio Gross profit margin Operating profit margin Net profit margin Rerun on total assets (ROA) Return on common equity (ROE) Earnings per share (EPS) "Based on a 365-day year aad oa end-of-year figures. 1.09 0.300 12.3 0.202 0.135 0.091 0.099 0.167 $3.10
Step by Step Solution
3.44 Rating (167 Votes )
There are 3 Steps involved in it
a Fox Manufacturing Company Ratio Analysis Industry Average 2009 Actual 2009 Current ratio 235 184 Quick ratio 087 075 Inventory turnover 455 times 56... View full answer

Get step-by-step solutions from verified subject matter experts
Document Format (1 attachment)
234-B-F-M-F (829).docx
120 KBs Word File