

Question: Use the MINITAB output in Figure (c) to do (1) through (6) for each of 0 , 1 , 2 , and
Use the MINITAB output in Figure (c) to do (1) through (6) for each of β0, β1, β2, and β3.
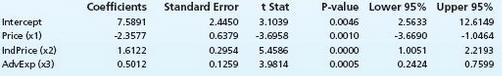
Coefficients 7.5891 -2.3577 1.6122 0.5012 Standard Error Intercept Price (t) IndPrice (x2) AdvExp (3) t Stat 2.4450 3.1039 0.6379 3.6958 0.2954 5.4586 0.1259 3.9814 P-value 0,0046 0.0010 0.0000 0.0005 Lower 95% 2.5633 3.6690 1.0051 0.2424 Upper 95% 12.6149 1.0464 2.2193 0.7599
Step by Step Solution
★★★★★
3.49 Rating (172 Votes )
There are 3 Steps involved in it
1 Expert Approved Answer
Step: 1 Unlock

y 0 1 x 1 2 x 2 3 x 3 df n k 1 30 3 1 26 Critical values t 02526 2056 ... View full answer
Question Has Been Solved by an Expert!
Get step-by-step solutions from verified subject matter experts
Step: 2 Unlock
Step: 3 Unlock
Document Format (1 attachment)
458-M-S-L-R (2083).docx
120 KBs Word File