

Question: We might expect credit card purchases to differ from cash purchases at the same store. Table P-15 contains daily gross sales and items sold for
We might expect credit card purchases to differ from cash purchases at the same store. Table P-15 contains daily gross sales and items sold for cash purchases and daily gross sales and items sold for credit card purchases at the same consignment store for 25 consecutive days.
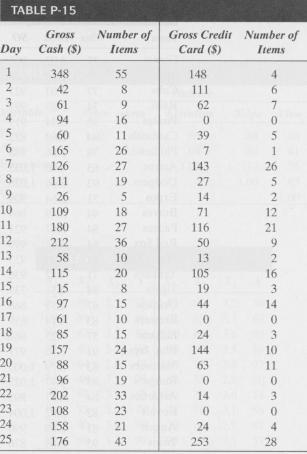
a. Make a scatter diagram of daily gross sales, Y, versus items sold for cash purchases, X1. Using a separate plot symbol or color, add daily gross sales and items sold for credit card purchases, X2. Visually compare the relationship between sales and number of items sold for cash with that for credit card purchases.
b. Define the dummy variable
and fit the regression
Y = β0 + β1X1 + β2X2 + ε
c. Analyze the fit in part b. Be sure to include an analysis of the residuals. Are you happy with your model?
d. Using the fitted model from part b, generate a forecast of daily sales for an individual that purchases 25 items and pays cash. Construct a large-sample 95% prediction interval for daily sales.
e. Describe the nature of the fitted function in part b. Do you think it is better to fit two separate straight lines, one for the cash sales and another for the credit card sales, to the data in Table P-15? Discuss.
be m to 467051 26 5 2 2 2 9 2 63403110304 28 rd 11 62 0 3 7 4 7 4 7 6 50 3 05 19 4424 44 63 o 4 0 4 5 5896-26 2 9 5 8 230 20 8 5 0 5 4 5 9 3 2 2 3 11221 1231 2 112 48 42 61 94 60 65 26 26 09 80 2 5 5 5 97 61 85 57 88 96 02 08 Da 1 2 3 4 5 6 7 8 9 0 1 2 3 4 5 6 7 8 9 2 2 2 2 2 2 I if cash purchase 0ifcredit card purchase
Step by Step Solution
3.40 Rating (147 Votes )
There are 3 Steps involved in it
a Scatter plot for cash purchases versus ... View full answer

Get step-by-step solutions from verified subject matter experts
Document Format (1 attachment)
628-M-S-L-R (5809).docx
120 KBs Word File