

Question: Weve seen already from this chapter that dividing up output over multiple producerseven when one has higher costs than the othercan lead to lower industry
We’ve seen already from this chapter that dividing up output over multiple producers—even when one has higher costs than the other—can lead to lower industry costs, so long as output is divided up such that MC1 = MC2 = MCN.
You’ve already done some practice in Facts and Tools question 3 with cost functions presented as tables. Let’s try to see how this works graphically.
Take a look at the following two marginal cost functions:
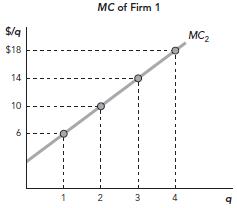
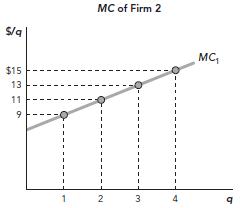
Based on the graphs of these two marginal cost functions, fill in the table below, for industry-wide marginal cost, assuming that production is divided up among the two firms according to Invisible Hand Principle 1. Then, create a graph of the industry marginal cost curve. To help you get started, take a look at the table and answer the following questions. Which firm produces the first unit of industry output? Which firm produces the second unit of industry output? Why?
Quantity Industry-Wide MC
1 ………………… $6
2 ………………… $9
3 …………………
4 …………………
5 …………………
6 …………………
7 …………………
8 …………………
MC of Firm 1 MC2 S/q $18 0 MC of Firm 2 S/q MCt $15 9
Step by Step Solution
3.47 Rating (173 Votes )
There are 3 Steps involved in it
The first unit of industry output is produced by F... View full answer

Get step-by-step solutions from verified subject matter experts
Document Format (1 attachment)
651-B-E-M-E (2821).docx
120 KBs Word File