

Question: Two automatic systems for dispensing maps are being compared by the state highway department. The accompanying breakeven chart of the comparison of these systems (System
Two automatic systems for dispensing maps are being compared by the state highway department. The accompanying breakeven chart of the comparison of these systems (System I vs System II) shows total yearly costs for the number of maps dispensed per year for both alternatives. Answer the following questions.
(a) What is the fixed cost for System I?
(b) What is the fixed cost for System II?
(c) What is the variable cost per map dispensed for System I?
(d) What is the variable cost per map dispensed for System II?
(e) What is the breakeven point in terms of maps dispensed at which the two systems have equal annual costs?
(f) For what range of annual number of maps dispensed is System I recommended?
(g) For what range of annual number of maps dispensed is System IT recommended?
(h) At 3000mapsper year, what are the marginal and average map costs for each system?
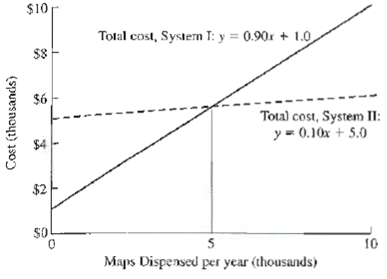
$10 Total cost, System T: y = 0.90x + 1.0 $8 $6 Total cost, System II: y = 0.10x + 5.0 $4 $2 $0 10 Maps Dispensed per year (thousands) Cost (thousands)
Step by Step Solution
3.35 Rating (170 Votes )
There are 3 Steps involved in it
x no of maps dispensed per year a Fixed Cost I 1000 b Fixed Cost II ... View full answer

Get step-by-step solutions from verified subject matter experts
Document Format (1 attachment)
7-B-E-M (41).docx
120 KBs Word File