

Question: A candy manufacturer has definite rules about the colour mixture of its candy-coated peanuts. Currently, the manufacturing process is set up to produce candies according
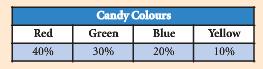
A candy manufacturer has definite rules about the colour mixture of its candy-coated peanuts. Currently, the manufacturing process is set up to produce candies according to the distribution shown in Exhibit 2.58.
In exhibit Candy Colour Desired Distribution
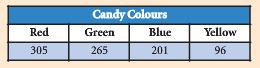
The company wants to be sure it is still achieving this colour balance after a recent reorganization of the production process at one of its plants. A random sample of candies is selected. The breakdown of colours is shown in Exhibit 2.59.
In exhibit Candy Colour Sample Distribution
Create an appropriate graph to assess whether the company is still achieving the desired colour balance at the plant after reorganizing the production process.
Candy Colours Yellow Blue 20% Red 40% Green 30% 10%
Step by Step Solution
3.36 Rating (162 Votes )
There are 3 Steps involved in it
The most effective graph would be a bar chart showing actual and des... View full answer

Get step-by-step solutions from verified subject matter experts
Document Format (1 attachment)
487-M-S-D-A (2046).docx
120 KBs Word File