

Question: The data in Table 5E.12 are the times it takes for a local payroll company to process checks (in minutes). The target value for the
The data in Table 5E.12 are the times it takes for a local payroll company to process checks (in minutes). The target value for the turnaround times is  minutes (two working days).
a. Estimate the process standard deviation.
b. Create a CUSUM chart for this process, using standardized values ![]() and
and . Interpret this chart.
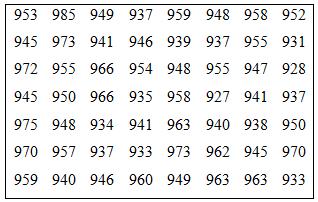
953 985 949 937 959 948 958 952 945 973 941 946 939 937 955 931 972 955 966 954 948 955 947 928 945 950 966 935 958 927 941 937 975 948 934 941 963 940 938 950 970 957 937 933 973 962 945 970 959 940 946 960 949 963 963 933 .
Step by Step Solution
3.47 Rating (180 Votes )
There are 3 Steps involved in it
a Construct a Moving Range chart to find and estimate standard deviation MTB Stat ... View full answer

Get step-by-step solutions from verified subject matter experts
Document Format (1 attachment)
552-M-S-Q-C-B-S (336).docx
120 KBs Word File