

Question: A new method of teaching reading is being tested on third grade students. A group of third grade students is taught using the new curriculum.
A new method of teaching reading is being tested on third grade students. A group of third grade students is taught using the new curriculum. A control group of third grade students is taught using the old curriculum. The reading test scores for the two groups are shown in the back-to-back stem-and-leaf plot.
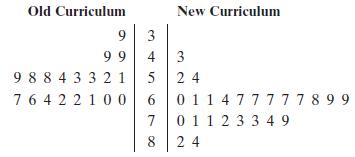
Key: 9 | 4 | 3 = 49 for old curriculum and 43 for new curriculum
At α = 0.10, is there enough evidence to support the claim that the new method of teaching reading produces higher reading test scores than the old method does? Assume the population variances are equal.
(a) Identify the claim and state H0 and Ha,
(b) Find the critical value(s) and identify the rejection region(s),
(c) Find the standardized test statistic t,
(d) Decide whether to reject or fail to reject the null hypothesis,
(e) Interpret the decision in the context of the original claim. Assume the samples are random and independent, and the populations are normally distributed. If convenient, use technology.
Old Curriculum New Curriculum 99 43 9 8 8 4 3 3 21 5 2 4 7 01 1 2 3 3 4 9 8 2 4
Step by Step Solution
3.38 Rating (167 Votes )
There are 3 Steps involved in it
a The claim is the new method of teaching reading produce... View full answer

Get step-by-step solutions from verified subject matter experts
Document Format (1 attachment)
598-M-S-H-T (3687).docx
120 KBs Word File