

A random sample of companies in electric utilities (I), financial services (II), and food processing (III) gave
Question:
A random sample of companies in electric utilities (I), financial services (II), and food processing (III) gave the following information regarding annual prots per employee (units in thousands of dollars).
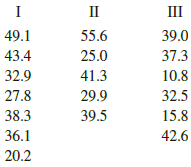
Shall we reject or not reject the claim that there is no difference in population mean annual prots per employee in each of the three types of companies? Use a 1% level of significance.
In each problem, please provide the following information.
(a) What is the level of significance? State the null and alternate hypotheses.
(b) Find SSTOT, SSBET, and SSW and check that SSTOT – SSBET + SSW. Find d.f.BET, d.f.W, MSBET, and MSW. Find the value of the sample test statistic F (F ratio).
What are the degrees of freedom?
(c) Find (or estimate) the P-value of the sample test statistic.
(d) Based on your answers in parts (a) to (c), will you reject or fail to reject the null hypothesis?
(e) Interpret your conclusion in the context of the application.
(f) Make a summary table for your ANOVA test.
Step by Step Answer:
a a 001 H 0 1 2 3 H 1 Not all the means are equal b Se...View the full answer


Understandable Statistics Concepts And Methods
ISBN: 9781337119917
12th Edition
Authors: Charles Henry Brase, Corrinne Pellillo Brase
