

Question: Where are the deer? Random samples of square-kilometer plots were taken in different ecological locations of Mesa Verde National Park. The deer counts per square
Where are the deer? Random samples of square-kilometer plots were taken in different ecological locations of Mesa Verde National Park. The deer counts per square kilometer were recorded and are shown in the following table (The Mule Deer of Mesa Verde National Park, edited by G. W. Mierau and J. L. Schmidt, Mesa Verde Museum Association).
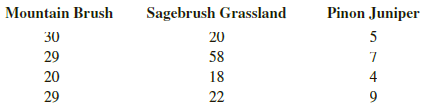
Shall we reject or accept the claim that there is no difference in the mean number of deer per square kilometer in these different ecological locations? Use a 5% level of significance.
In the problem, please provide the following information.
(a) What is the level of significance? State the null and alternate hypotheses.
(b) Find SSTOT, SSBET, and SSW and check that SSTOT – SSBET + SSW. Find d.f.BET, d.f.W, MSBET, and MSW. Find the value of the sample test statistic F (F ratio).
What are the degrees of freedom?
(c) Find (or estimate) the P-value of the sample test statistic.
(d) Based on your answers in parts (a) to (c), will you reject or fail to reject the null hypothesis?
(e) Interpret your conclusion in the context of the application.
(f) Make a summary table for your ANOVA test.
Mountain Brush Sagebrush Grassland Pi Juniper 20 58 18 34) 29 20 29
Step by Step Solution
3.24 Rating (159 Votes )
There are 3 Steps involved in it
a a 005 H 0 1 2 3 H 1 Not all the means are equal b Se... View full answer

Get step-by-step solutions from verified subject matter experts
Document Format (1 attachment)
1275-M-S-P-E(1449).docx
120 KBs Word File