

Question: A sales analyst wants to determine whether there is a difference in the mean monthly sales of a companys four sales regions. Several salespersons from
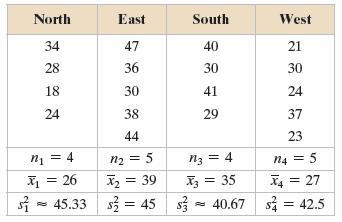
A sales analyst wants to determine whether there is a difference in the mean monthly sales of a company’s four sales regions. Several salespersons from each region are randomly selected and they provide their sales amounts (in thousands of dollars) for the previous month. The results are shown in the table. At α = 0.05, can the analyst conclude that there is a difference in the mean monthly sales among the sales regions? Assume that each population of sales is normally distributed and that the population variances are equal.
a. Identify the claim and state H0 and Ha.
b. Identify the level of significance α.
c. Determine the degrees of freedom for the numerator and the denominator.
d. Find the critical value F0 and identify the rejection region.
e. Find the test statistic F. Sketch a graph.
f. Decide whether to reject the null hypothesis.
g. Interpret the decision in the context of the original claim.
North 34 28 18 24 East 47 36 30 38 West 21 30 24 37 23 South 30 41 29 4 = 26 5 R4-27 x2=39 =35 5335-4067 3
Step by Step Solution
3.40 Rating (163 Votes )
There are 3 Steps involved in it
a The claim is there is a difference in the mean a ... View full answer

Get step-by-step solutions from verified subject matter experts
Document Format (1 attachment)
598-M-S-C-S-T (883).docx
120 KBs Word File