

Question: The data shown in the table represent the GPAs of randomly selected freshmen, sophomores, juniors, and seniors. At = 0.05, can you conclude that
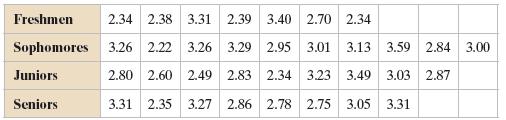
The data shown in the table represent the GPAs of randomly selected freshmen, sophomores, juniors, and seniors. At α = 0.05, can you conclude that there is a difference in the means of the GPAs? Assume that the populations of GPAs are normally distributed and that the population variances are equal. Use technology to test the claim.
a. Identify the claim and state H0 and Ha.
b. Enter the data.
c. Perform the ANOVA test to find the P-value.
d. Decide whether to reject the null hypothesis.
e. Interpret the decision in the context of the claim.
Freshmen 2.34 2.38 3.31 2.39 3.40 2.70 2.34 Sophomors 3.26 2.22 3.26 3.29 3.01 3.13 3.59 2.84 3.00 Juniors Seniors 2.80 2.60 2.49 2.83 2.34 3.23 3.49 3.03 2.87 3.31 2.35 3.27 2.86 2.78 2.75 3.05 3.31
Step by Step Solution
3.26 Rating (164 Votes )
There are 3 Steps involved in it
a The claim is there is a difference in the means of the GPAs H 0 1 2 3 4 H a At leas... View full answer

Get step-by-step solutions from verified subject matter experts
Document Format (1 attachment)
598-M-S-C-S-T (884).docx
120 KBs Word File