

Question: A sample of 100 colored balls is selected from a large container of red balls and white ballscall it Container A. A second sample, this
A sample of 100 colored balls is selected from a large container of red balls and white balls—call it Container A. A second sample, this one of size 150, is selected from another container of red balls and white balls—call it Container B. The table below shows results from the two samples.
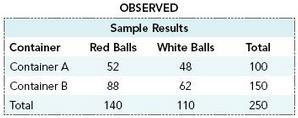
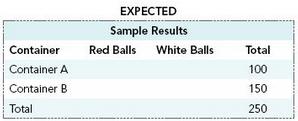
You plan to use a chi square test to test the null hypothesis that the two containers contain the same proportion of red balls.
a. Below is the table for EXPECTED results if the null hypothesis is true. Fill in the table. Begin in the upper left-hand cell and enter the expected number of red balls in the Container A sample if the null hypothesis is true.
b. Compute the proper chi square value by comparing observed and expected values.
c. Use a significance level of .05 for your test and report your conclusion.
OBSERVED Sample Results Container Red Balls White Balls Total Container A 52 Container EB Total 48 62 110 100 150 250 140 EXPECTED Sample Results Containe Red Balls White Balls Total Container A Container B Total 100 150 250
Step by Step Solution
3.33 Rating (171 Votes )
There are 3 Steps involved in it
a H 0 1 2 The population proportions are equal H a The population proportions are dif... View full answer

Get step-by-step solutions from verified subject matter experts
Document Format (1 attachment)
486-M-S-C-S-T (168).docx
120 KBs Word File