

Question: (a) The table shows raw scores on a state civil service exam taken by 24 applicants for positions in law enforcement. Construct a frequency distribution
(a) The table shows raw scores on a state civil service exam taken by 24 applicants for positions in law enforcement. Construct a frequency distribution and histogram, using nice (round) bin limits.
(b) Describe the distribution and note any unusual features.
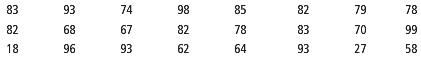
83 93 74 78 70 18 62 93 27 58
Step by Step Solution
★★★★★
3.40 Rating (166 Votes )
There are 3 Steps involved in it
1 Expert Approved Answer
Step: 1 Unlock

a We would use 9 bins each with a width of 10 The frequency d... View full answer
Question Has Been Solved by an Expert!
Get step-by-step solutions from verified subject matter experts
Step: 2 Unlock
Step: 3 Unlock
Document Format (1 attachment)
485-M-S-D-A (3074).docx
120 KBs Word File