

Question: a. Calculate the centroids for each group in the analysis sample. What do these values indicate? b. Use the regression approach to two-group DA to
a. Calculate the centroids for each group in the analysis sample. What do these values indicate?
b. Use the regression approach to two-group DA to develop a rule for predicting whether or not a household will respond to a credit card solicitation. State the classification rule you identify.
c. Use the classification rule you identify in question 2 to classify each observation in the analysis sample. Create a confusion matrix summarizing the classification results. Overall, how accurate does this classification rule seem to be?
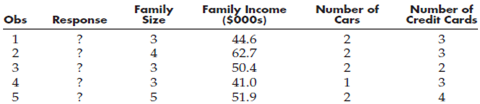
d. Suppose that the CU also gave you the data below on six additional households. Based on the classification rule you developed using regression, which (if any) of the six new households would you expect to accept a credit card solicitation?
e. CU also wants you to analyze the data using the Mahalanobis distance measure approach discussed in this chapter. Carry out this analysis. Which of the two methods would you recommend that the CU use?
CapitalUno (CU) is one of the largest credit card issuers in the United States. CU uses television commercials and direct mail as its primary means of offering cards to potential customers. CU spends millions of dollars each year on the postage and printing costs associated with its direct mail marketing efforts. Throughout the industry, the response rate to direct mail solicitations is notoriously low. As a result, CU could reduce the cost and increase the effectiveness of its direct mail marketing efforts drastically if it could do a better job of predicting who might and might not respond to its credit card solicitations.
Firms in the financial services industry often share information with each other about the demographic and financial attributes of their customers. Using this information, CU created and maintains a massive database for its direct mail activities. Each record in the database contains detailed data about each household in their coverage area. Thus, in addition to the family name and address at each household, CU has information about the number of people in each household, the family income level, the number of cars the family owns, and the number of bank credit cards held by each family. CU wants to use this information to develop a predictive model for whether or not a household will respond positively to a direct mail solicitation.
As an experiment, CU sent credit cards offers to 20 households. The data found in the file CapitalUno.xls summarizes the demographics and response to the solicitation for each household. A response value of 1 indicates that the household did not respond, whereas a 2 indicates the acceptance of the credit card offer.
Family Size Family Income (s00s) 44.6 62.7 50.4 41.0 51.9 Number of Cars Number of Response Obs Credit Cards 3 3 2 2 3 4 3 5.
Step by Step Solution
3.41 Rating (179 Votes )
There are 3 Steps involved in it
a Obs Response Family Size Family Income 000s Number of Cars Numer of Credit Cards Dscrm Score Predicted Group 1 1 5 504 2 3 15938 2 2 1 4 785 1 1 069... View full answer

Get step-by-step solutions from verified subject matter experts
Document Format (1 attachment)
167-B-M-L-M-D-A (317).xlsx
300 KBs Excel File