

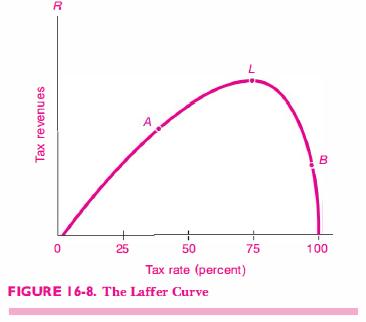
Question: An interesting question involves the Laffer curve, named for California economist and sometime senatorial candidate Arthur Laffer. In Figure 16-8, the Laffer curve shows how
An interesting question involves the Laffer curve, named for California economist and sometime senatorial candidate Arthur Laffer. In Figure 16-8, the Laffer curve shows how revenues rise as tax rates are increased, reach a maximum at point L, and then decline to zero at a 100 percent tax rate as activity is completely discouraged.
The exact shape of the Laffer curve for different taxes is highly controversial.
A common mistake in discussing taxes is the post hoc fallacy (see Chapter l's discussion of this). Proponents of lower taxes often invoke the Laffer curve in their arguments. They point to tax cuts of the 1960s
to suggest that the economy is to the right of the peak of Mt. Laffer, say, at B. They say, in effect, "After the Kennedy: Johnson tax cuts of 1964, federal revenues actually rose $110 billion in 1963 to $133 billion in 1966. Therefore, cutting taxes raises revenues." Explain why this does not prove that the economy was to the right of L. Further explain why this is an example of the post hoc fallacy. Give a correct analysis.
8 0 25 50 75 100 Tax rate (percent) 6 FIGURE 16-8. The Laffer Curve
Step by Step Solution
3.47 Rating (160 Votes )
There are 3 Steps involved in it
Correlation does not imply causation To analyze the ex... View full answer

Get step-by-step solutions from verified subject matter experts
Document Format (1 attachment)
673-B-E-M-E (4161).docx
120 KBs Word File