

Question: Answer the following questions using the data from the Excel file AOL. xlsx described in Problem 16.30: From Problem a. Forecast the advertising revenue for
Answer the following questions using the data from the Excel file AOL. xlsx described in Problem 16.30:
From Problem
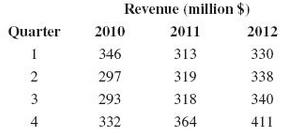
a. Forecast the advertising revenue for each quarter in 2013 using seasonal dummy variables and a best subsets regression.
b. Interpret the meaning of the coefficients for the seasonal dummy variables.
Revenue (million s) Quate 346 297 293 332 2011 313 319 318 364 2012 330 338 340 411 4
Step by Step Solution
3.44 Rating (173 Votes )
There are 3 Steps involved in it
a Dummy Variables SD1 SD2 SD3 Quarter 1 0 0 0 Quarter 2 1 0 0 Quarter 3 0 1 0 Quarter 4 0 0 1 Set ... View full answer

Get step-by-step solutions from verified subject matter experts
Document Format (1 attachment)
483-M-S-F (260).docx
120 KBs Word File