

Question: The net weight of a soft drink is to be monitored by and R control charts using a sample size of n = 5. Data
The net weight of a soft drink is to be monitored by ![]() and R control charts using a sample size of n = 5. Data for 20 preliminary samples are shown in Table 5E.2.
and R control charts using a sample size of n = 5. Data for 20 preliminary samples are shown in Table 5E.2.
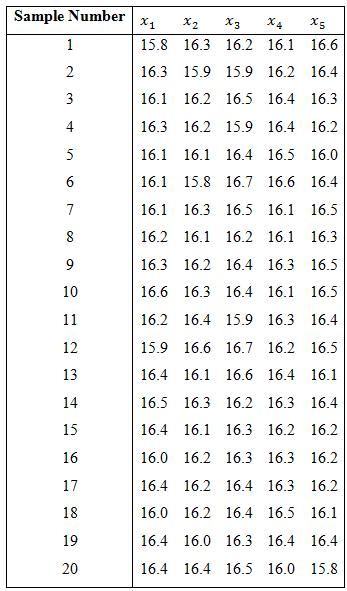
a. Set up ![]() and R control charts using these data. Does the process exhibit statistical control?
and R control charts using these data. Does the process exhibit statistical control?
b. Estimate the process mean and standard deviation.
c. Does fill weight seem to follow a normal distribution?
Sample Number x, 15.8 16.3 16.2 16.1 16.6 16.3 15.9 15.9 16.2 16.4 16.1 16.2 16.5 16.4 16.3 16.3 16.2 15.9 16.4 16.2 16.1 16.1 16.4 16.5 16.0 16.1 15.8 16.7 16.6 16.4 16.1 16.3 16.5 16.1 16.5 16.2 16.1 16.2 16.1 16.3 16.3 16.2 16.4 16.3 16.5 16.6 16.3 16.4 16.1 16.5 16.2 16.4 15.9 16.3 16.4 15.9 16.6 16.7 16.2 16.5 16.4 16.1 16.6 16.4 16.1 16.5 16.3 16.2 16.3 16.4 16.4 16.1 16.3 16.2 16.2 16.0 16.2 16.3 16.3 16.2 16.4 16.2 16.4 16.3 16.2 16.0 16.2 16.4 16.5 16.1 16.4 16.0 16.3 16.4 16.4 16.4 16.4 16.5 16.0 15.8 10 12 13 14 15 16 17 18 19 20
Step by Step Solution
3.55 Rating (173 Votes )
There are 3 Steps involved in it
a MTB Stat Control Charts Variables Charts for Subgroups XbarR The proc... View full answer

Get step-by-step solutions from verified subject matter experts
Document Format (1 attachment)
552-M-S-Q-C-B-S (322).docx
120 KBs Word File