

Question: Below is a less than or equal to cumulative relative frequency table showing the results of a National Rifle Association survey of gun ownership in
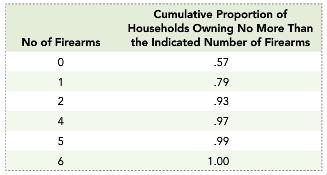
Below is a “less than or equal to” cumulative relative frequency table showing the results of a National Rifle Association survey of gun ownership in Oregon. The table is based on data collected from 2000 Oregon residents:
a. Show the relative frequency table that’s the basis of this “less than or equal to” cumulative relative frequency table.
b. Use the table you produced in part a to compute the mean, the variance and the standard deviation for the data shown here.
Cumulative Proportion of Households Owning No More Than the Indicated Number of Firearms No of Firearms .57 79 93 97 1.00
Step by Step Solution
3.50 Rating (170 Votes )
There are 3 Steps involved in it
a Number of Firearms x Proportion of Households Owning the Indicated ... View full answer

Get step-by-step solutions from verified subject matter experts
Document Format (1 attachment)
486-M-S-D-A (2433).docx
120 KBs Word File