

Question: Below we give the overall dining experience ratings (Outstanding, Very Good, Good, Average, or Poor) of 30 randomly selected patrons at a restaurant on a
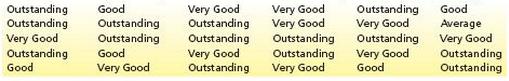
Below we give the overall dining experience ratings (Outstanding, Very Good, Good, Average, or Poor) of 30 randomly selected patrons at a restaurant on a Saturday evening.
a. Find the frequency distribution and relative frequency distribution for these data.
b. Construct a percentage bar chart for these data.
c. Construct a percentage pie chart for these data.
Good Outstanding Outstanding Outstanding Outstanding Very Good Very Good utstanding Very Good Good Very Good Very Good Outstanding Good Outstanding Outstanding Outstanding Outstanding Very Good ery Good Average Very Good Outstanding Good Good Very Good Outstanding Very Good Outstanding Outstanding
Step by Step Solution
3.48 Rating (168 Votes )
There are 3 Steps involved in it
a b c Rating Outstanding Very ... View full answer

Get step-by-step solutions from verified subject matter experts
Document Format (1 attachment)
458-M-C-M-S (175).docx
120 KBs Word File