

Question: Calculate the 95% confidence intervals for the S&P/ TSX Composite Index, the S&P 500 in CAD, and long-term Government of Canada bonds included in Figures
Calculate the 95% confidence intervals for the S&P/ TSX Composite Index, the S&P 500 in CAD, and long-term Government of Canada bonds included in Figures 10.3 and 10.4?
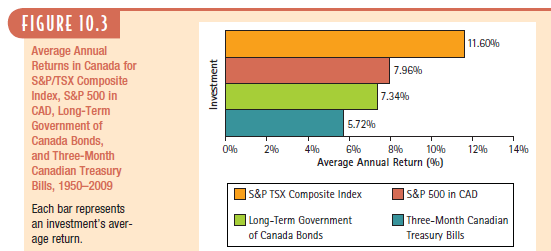
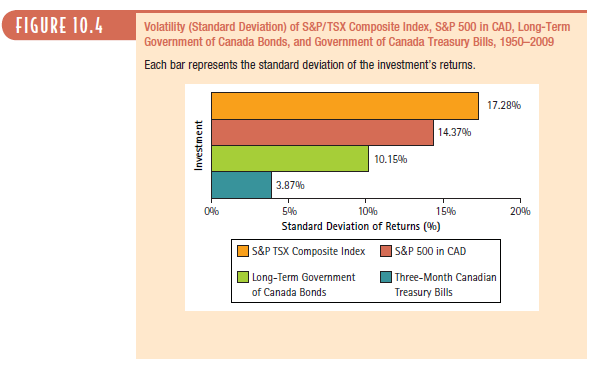
FIGURE 10.3 11.60% Average Annual Returns in Canada for S&P/TSX Composite Index, S&P 500 in CAD, Long-Term 7.96% 7.34% Government of 5.72% Canada Bonds, 0% 2% 4% 8% 10% 12% 14% and Three-Month Average Annual Return (%) Canadian Treasury Bills, 19502009 S&P TSX Composite Index S&P 500 in CAD Each bar represents an investment's aver- | Long-Term Government Three-Month Canadian age return. of Canada Bonds Treasury Bills Investment
Step by Step Solution
3.46 Rating (159 Votes )
There are 3 Steps involved in it
Plan Given the data in Figures 103 and 104 calculat... View full answer

Get step-by-step solutions from verified subject matter experts
Document Format (1 attachment)
1198-B-C-F-O(1194).docx
120 KBs Word File