

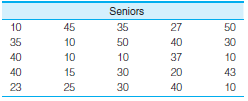
Question: Compute the standard deviation for both sets of data presented in problem 3.13 and reproduced here. Compare the standard deviation computed for freshmen with the
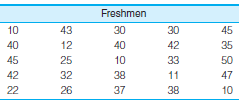
Freshmen 10 43 30 30 45 40 12 40 42 35 45 25 10 33 50 42 32 38 11 47 22 26 37 38 10
Step by Step Solution
★★★★★
3.29 Rating (164 Votes )
There are 3 Steps involved in it
1 Expert Approved Answer
Step: 1 Unlock

Freshman Senio... View full answer
Question Has Been Solved by an Expert!
Get step-by-step solutions from verified subject matter experts
Step: 2 Unlock
Step: 3 Unlock
Document Format (1 attachment)
757-M-S-H-T (4499).docx
120 KBs Word File