

Question: Consider the data of Table 17.1. Suppose that additional samples of size 5 are taken and tensile strength recorded. The sampling produces the following results
Consider the data of Table 17.1. Suppose that additional samples of size 5 are taken and tensile strength recorded. The sampling produces the following results (in pounds per square inch).(a) Plot the data, using the X- and R - charts for the preliminary data of Table 17.1.(b) Docs the process appears to be in control? If not, explainwhy.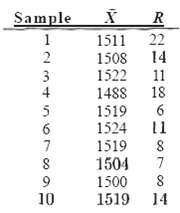
Sample R 22 14 1511 1508 1522 1488 1519 1524 1519 1504 1500 1519 14 3 4 11 18 11 10 8.
Step by Step Solution
3.39 Rating (168 Votes )
There are 3 Steps involved in it
Combining all 35 data values we have 1508491 R 11057 1525 1520 1515 151... View full answer

Get step-by-step solutions from verified subject matter experts
Document Format (1 attachment)
18-M-S-Q-C-B-S (5).docx
120 KBs Word File